
- Diese Veranstaltung hat bereits stattgefunden.
Statistische Prozesssteuerung – neu gedacht für Verbesserungen in der Gesundheitsvorsorge
Online-Vortrag.
Für dieses online-Seminar haben wir den dänischen Arzt Jacob Anhøj gewinnen können. Seit gut 20 Jahren beschäftigt er sich mit statistischer Prozesskontrolle und kann uns manche neue Perspektive aufzeigen. So sagt er zum Beispiel:
„Die Gesundheit einer Person können wir nicht in der gleichen Weise steuern wie den Durchmesser einer Schraube oder die Konzentration einer chemischen Lösung. Das müssen wir bei der Prozesssteuerung berücksichtigen.“
Wir freuen uns deshalb auf neue Impulse und eine anregende Diskussion und fügen den von Herrn Anhøj verfassten „Abstract“ an, den wir für lesenswert halten. Wir empfehlen auch die unten aufgeführten Referenzen.
Hinweis:
Dieser Vortrag wird auf Englisch gehalten.
Fragen können auch auf Deutsch gestellt werden.
+++ Dieser Vortrag war ursprünglich für den 16. September geplant. Aufgrund technischer Probleme haben wir ihn auf den 7. Oktober verschoben. ++++
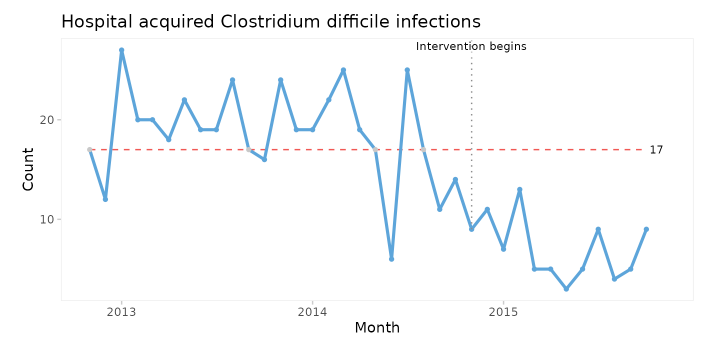
Rethinking statistical process control for healthcare improvement
Statistical process control (SPC) was originally developed as a tool to monitor and control the quality of goods produced in the manufacturing industry. Today SPC has found its way into service industries including healthcare. While the thinking behind SPC is the same regardless of the domain, the practical application of SPC varies somewhat.

First, healthcare is all about people, which which we, contrary to what we like to believe, have very little control over. We cannot simply adjust the health of a person in the same way that we can adjust the diameter of a bolt or the concentration of a chemical solution. For this reason, SPC in healthcare is more about processes (what we do) than about outcomes (what happens). Also, because of the huge knowing-doing gap, SPC in healthcare is much more about improving processes that controlling them.

Second, healthcare workers and managers are generally not trained in SPC, and very few know how to construct and interpret a Shewhart control chart. Perhaps for this reason run charts have become popular. A run chart is a time series chart without control limits and with the median as the centre line. It is easy to construct using only pen and paper. Runs analysis comprise test for non-random variation in the distribution of data points around the median and makes no assumptions regarding the underlying theoretical distribution of data.

Run charts are generally considered less useful than control charts.
In reality, runs analysis, applied sensibly, is better at detecting minor persistent shifts in data over time than the traditional Shewhart control chart.

This talk will introduce the concept of runs analysis and its application and suggest a way to reconcile run and control charts to get the best of both worlds.


References

Jacob Anhøj, Anne Vingaard Olesen (2014). Run Charts Revisited: A Simulation Study of Run Chart Rules for Detection of Non-Random Variation in Health Care Processes (https://journals.plos.org/plosone/article?id=10.1371/journal.pone.0113825)

Jacob Anhøj (2015). Diagnostic Value of Run Chart Analysis: Using Likelihood Ratios to Compare Run Chart Rules on Simulated Data Series (https://journals.plos.org/plosone/article?id=10.1371/journal.pone.0121349)

Jacob Anhøj, Anne-Marie Blok Hellesøe (2017). The problem with red, amber, green: the need to avoid distraction by random variation in organisational performance measures (https://qualitysafety.bmj.com/content/26/1/81)

Jacob Anhøj, Tore Wentzel-Larsen (2018). Sense and sensibility: on the diagnostic value of control chart rules for detection of shifts in time series data (https://bmcmedresmethodol.biomedcentral.com/articles/10.1186/s12874-018-0564-0)

Jacob Anhøj, Tore Wentzel-Larsen (2020). Smooth operator: Modifying the Anhøj rules to improve runs analysis in statistical process control (https://journals.plos.org/plosone/article?id=10.1371/journal.pone.0233920)

Jacob Anhøj (2022). Quality Improvement Charts - An implementation of statistical process control charts for R (https://anhoej.github.io/qicharts2/articles/qicharts2.html)
